Lesson 7 | ABCD and 1.382: Every Trend Starts as a Seedling
Rhythm Trading, Lesson 7. Up-pullback-up or down-bounce-down is the seedling of a trend (ABCD). D has to reach 1.382 of the BC leg for the seedling to count and for C to become valid. How to calculate and measure 1.382.

I wrote this guide based on how I actually trade gold. No theory — just what works after 10 years.
Key takeaways
- A trend starts with up-pullback-up or down-bounce-down, the seedling. The seedling only counts once D reaches 1.382 of the BC leg.
In one sentence
A trend starts with up-pullback-up or down-bounce-down, the seedling. The seedling only counts once D reaches 1.382 of the BC leg.
An analogy
To grow a tree, you pick a seedling first. A good seedling is likely to become a big tree; a poor one won't. In the market the seedling is this first structure, and 1.382 is the ruler that tells you whether the seedling is any good.
What ABCD is
Every timeframe, monthly, daily or one-minute, has its own trend, and every trend begins with an N shape.
| Direction | Four points | Shape |
|---|---|---|
| Up (up-pullback-up) | A start → B high → C pullback low → D rises again | N |
| Down (down-bounce-down) | A start → B low → C bounce high → D falls again | Inverted N |
How to measure 1.382
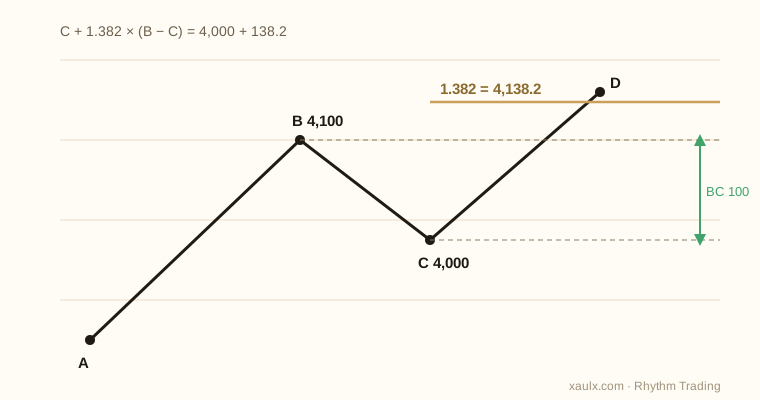
You measure the B to C leg and check whether D reaches its 1.382.
Uptrend: 1.382 level = C + 1.382 × (B − C)
Downtrend: 1.382 level = C − 1.382 × (C − B)
A round-number example: gold rises from A to B = 4,100 and pulls back to C = 4,000. BC is 100 dollars. The 1.382 level is 4,000 + 138.2 = 4,138.2. If D touches 4,138.2, the seedling counts.
On a platform you don't need to calculate: drag the Fibonacci tool from B to C and read the 1.382 level.
"A touch counts"
D only needs to touch 1.382. Whether price holds above it is a separate question. A wick touching it counts too.
What a touch means
- The seedling is confirmed; price is more likely to keep going in this direction.
- C's support (resistance in a downtrend) is confirmed, so C becomes a valid point (Lesson 9).
- The proportion of AB that C retraced becomes the basis for the rhythm line later (Lesson 11).
The order for finding ABCD
- Wait for A and B.
- Wait for the pullback to make C.
- Once D appears, drag the Fibonacci tool from B to C and see whether D touched 1.382.
Until price has made ABCD, you can't call the seedling good; you can only wait. Many people see a break and assume a fall. Wait until down-bounce-down is complete and 1.382 is reached; only then does it count.
The most common mistakes
- Measuring the wrong leg. It's BC, not AB.
- Deciding before D has formed.
- Confusing "touch" with "hold above". A touch counts; holding is a later question.
Explain it in your own words
- What are the four points of up-pullback-up?
- With B = 4,100 and C = 4,000, where is 1.382?
- Once D touches 1.382, what changes about C?
Practice
On the gold daily chart find three up-pullback-up and three down-bounce-down structures. Drag the Fibonacci tool from B to C on each, mark 1.382 and note whether D touched it.
Previous: Lesson 6 | Two drawing tools: Fibonacci and percentage lines Next: Lesson 8 | 1.382 tells strength
This course teaches a method using past price action as examples. It does not forecast prices, recommend any broker or give investment advice.
Lesson quiz
Get 2 right to unlock the next lesson.
1. In up-pullback-up, which leg does 1.382 measure?
2. B = 4,100, C = 4,000. Where is the 1.382 level in an uptrend?
3. D's wick touched 1.382 but the candle closed below it. Does it count?
I don't predict. I prepare. Every trade I share here is placed with real money, in real time. No indicators, no noise — just price action and experience.
— Happy trading, Lin
Recommended Brokers
Recommended: Visit EBC → — tested across all sessions.
Start Trading Gold →Recommended: Visit Wisuno → — tested across all sessions.
Start Trading Gold →LIN'S GOLD LETTER
One email a week on what moved gold
Every Sunday: the week in gold, the data to watch next week, and the notes worth rereading. No signals for sale, no spam.
Unsubscribe with one click from any email. We never share your address.
Related Guides
On this page
More from Lin's Desk
Hand-picked by Lin — from my trading desk to yours.
Lesson 14 | Pushing On and Unwinding: Back to the Line, Back to the Point
This covers the strategy I use during US session trading. Tested across hundreds of sessions.
5 min readLesson 13 | Redefining the Trend: Watch Where Pullbacks Stop, Not Just Highs and Lows
I put this together after years of refining my own method. No fluff, just what works.
5 min readLesson 12 | Three Jobs of a Rhythm Line: Resistance, Direction, Strength
This covers the strategy I use during US session trading. Tested across hundreds of sessions.
5 min readLesson 11 | How to Draw a Rhythm Line
This covers the strategy I use during US session trading. Tested across hundreds of sessions.
5 min readLesson 10 | Strength Lines: The Line Without a 1.382
This covers the strategy I use during US session trading. Tested across hundreds of sessions.
5 min read