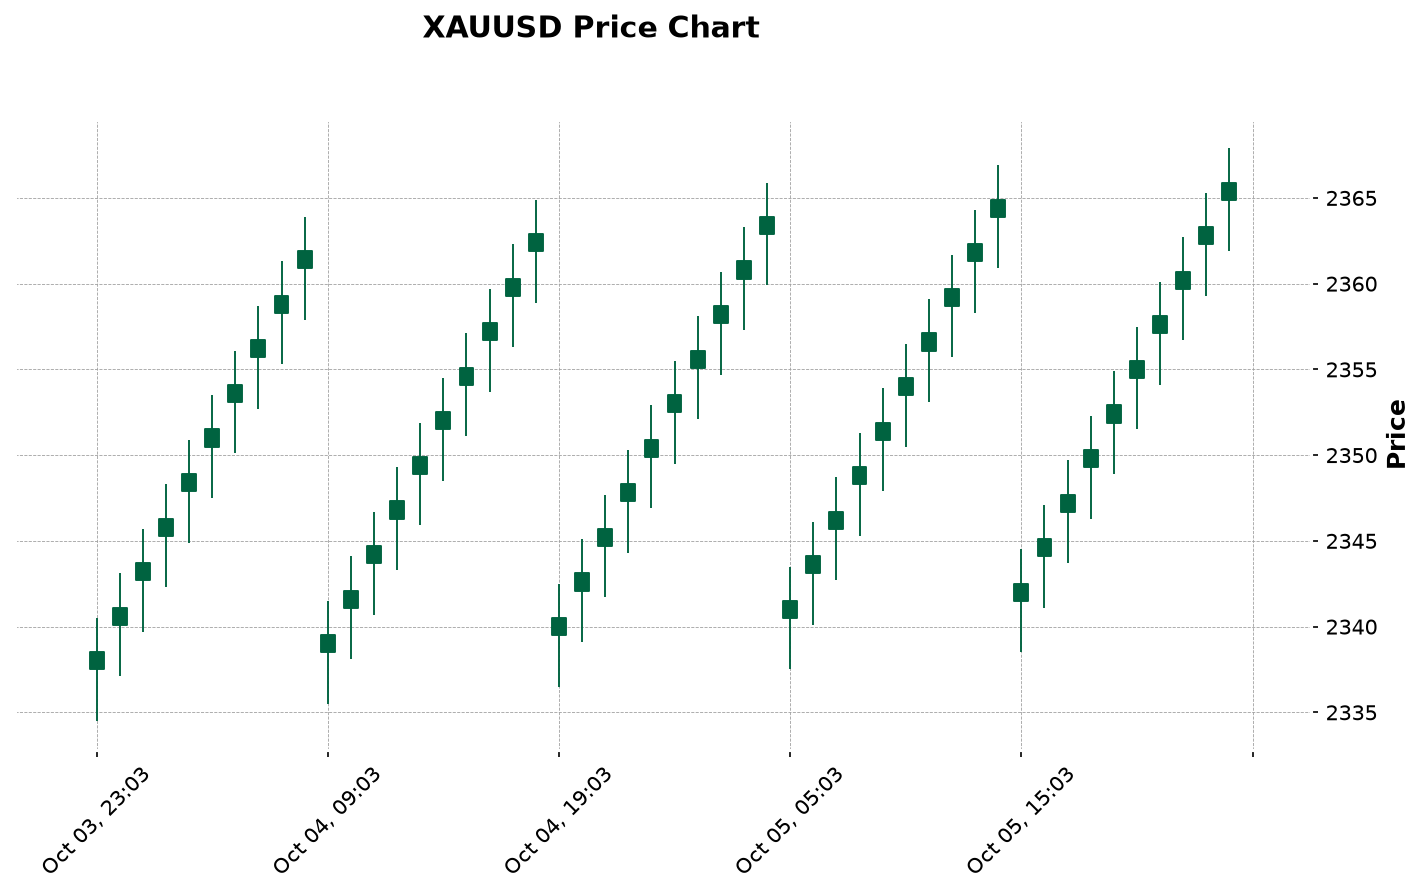
Last week I had three charts up on the screen at the same time. Gold on the D1. Dollar index. US 10-year yield. All three green.
And I just sat there looking at it because, honestly, none of them were supposed to be green together. Not according to anything I learned early on.
Ten years ago that combo would've messed with my head. Dollar bid, yields climbing — I'd have shorted gold without blinking. Then I'd have taken the loss and told myself it was a lesson in respecting the textbook.
Except the textbook's wrong. Or at least, it's not the whole picture. Not the way people think.
So here's the question I actually sit with every morning, coffee in hand, before I touch anything: what if the triangle everyone draws on a whiteboard is missing the only vertex that matters?
Gold, the dollar, and Treasury yields don't share some fixed inverse relationship. They share a regime. Change the regime and the entire geometry flips on you.
Let me walk through how I read each leg. When I trust it. And when I ignore it completely.
The Textbook Model Is a Fairytale With a Useful Moral
Here's the story everyone gets told. Gold pays no coupon. So when Treasury yields rise, holding gold becomes expensive relative to holding a bond. And the dollar is the denomination, right? So when the dollar strengthens, gold gets more expensive for everyone else and demand falls. Two clean inverse relationships. Elegant. And wrong often enough to cost you real money.
Why does it break? Because each leg of that triangle is driven by something different, and those drivers rotate in importance. The correlation between gold and yields isn't physics. It's a temporary agreement between three markets about what matters that week.
When the agreement holds, the inverse looks textbook. When it doesn't? Every analyst on TV sounds like they're reading from a script someone shredded and taped back together wrong.
Leg One: Real Yields Are the Engine, Nominal Yields Are the Dashboard
The number on your screen labeled "10-year yield" — that's a headline, not a driver.
What gold actually trades against is the real yield. Nominal yield minus inflation expectations. The gap, not the print. When the Fed raises rates into falling inflation expectations, real yields climb hard and gold has a genuine reason to sell off. That's the version of the inverse that actually works.
But when the Fed raises rates into rising inflation expectations? Nominal yields can climb while the real yield stays flat. And gold doesn't care at all. Same headline. Opposite outcome.
I watched this play out through the 2022 hiking cycle. The old playbook said gold had no business holding with real yields going sharply positive. It sold off for months. Then it reversed and rallied anyway while real yields stayed elevated. Everyone trading the headline got run over. The people watching the gap figured it out.
This is the leg I trust most. And I still only give it maybe 70% confidence in any given week. So when someone tells you the real yield relationship is reliable, ask one question: how did their gold book do in Q4 2022?
Leg Two: The Dollar Is a Liquidity Barometer Before It's a Price
Most traders treat the dollar as a translation problem. Dollar up, gold more expensive for foreign buyers, demand down. That's the second-grade version.
The version that pays is liquidity. The dollar is the world's funding currency. When global institutions are short dollars, they sell whatever they can to raise them. And gold gets sold alongside everything else — even when the reason for the stress should logically push gold higher.
I've watched gold fall on a day when the news should've sent it parabolic. Was that the safe-haven story failing? No. That was a margin call.
The dollar tells you whether the world is starving for funding or drowning in it. When funding is scarce, gold is a source of cash, not a shelter. When funding is abundant, gold becomes a shelter again.
One distinction. It has saved me more money than any indicator I've ever paid for.
Leg Three: The Fear Bid Overrides Everything, Then Fades
Here's the leg most frameworks ignore. Geopolitical and credit stress.
During a real shock, the correlations go to zero. Gold trades on fear, yields trade on flight-to-quality, the dollar trades on global demand for safety. All three can move in the same direction at once and the inverse relationship people draw on their charts just stops existing for the duration of the move.
I learned how to handle this one the hard way. Chased a fear spike once. Bought into the top of the candle. Watched it mean-revert over the next several sessions and paid for the education. Fear moves are real. The entries are almost always terrible. The move is emotional — and if you buy it emotionally, you're the exit liquidity.
My rule now is simple. Fear spikes are for reducing size and managing what I already hold. They are not for initiating new positions. The structure isn't there yet. The panic is the entry for someone else, not for me.
If you take one thing from this whole piece, take this: the triangle doesn't have three vertices. It has three regimes. And the vertex that leads changes with the regime.
The Regime Map: Which Leg Leads, and When
This is where the comparison actually lands. I sort every week into one of three regimes. And the regime tells me which leg to watch and which two to mute.
Regime A — the inflation regime. Inflation expectations rising faster than nominal yields. Real yields stay flat or fall. Gold and the dollar can rise together, which drives everyone insane. In this regime the dollar is the wrong signal. I watch the gap between nominal yields and inflation expectations and I treat dollar strength as noise unless it's extreme.
Regime B — the tightening regime. The Fed is draining liquidity and real yields are climbing. The dollar and yields lead together, gold absorbs the pain, and the textbook inverse works beautifully. This is the regime where shorting rallies in gold is the path of least resistance. And where dollar strength is a real, actionable signal rather than a distraction.
Regime C — the stress regime. Geopolitics, credit events, funding squeezes. The correlations break. Gold trades on fear, yields trade on flight-to-quality, the dollar trades on global dollar demand. Nothing is reliable here except your position sizing. I reduce exposure, tighten my stops, and wait for the regime to resolve before I take structure trades again.
So why do so many traders keep shorting gold just because the dollar is bid? Because they're running a Regime B playbook in a Regime A market. The dollar was never the signal that week. The regime was different. And they paid for reading the wrong chart.
I've done it. Twice. The tuition wasn't cheap.
How the Triangle Actually Shows Up on My Screen
I trade XAUUSD on the D1 with Fibonacci levels as my structure tool. The triangle is a filter, not a signal. It tells me which chart to trust that week. The Fib levels tell me where to act.
My morning goes like this. Mark the D1 trend first. Then mark the swing high and swing low from the recent move and draw the retracement levels in between. Then look at the dollar and the yield gap and ask which regime I'm in.
If I'm in Regime B, I favor shorts into the retracement levels that line up with dollar strength. If I'm in Regime A, I fade dollar pops in gold because the dollar isn't the lead. If I'm in Regime C, I don't take new structure trades at all until the panic resolves.
Not every setup survives this filter. That's the point.
I wait for the US session to confirm before I commit. The NY open is where the real order flow shows up. London can fake a move. Asia can fake a range. NY is where the market decides.
What the Triangle Can't Tell You
I'd be lying if I said this framework explains every move. It doesn't.
Central bank reserve buying has been a structural bid under gold for a while now. And in the short term it doesn't care about yields or the dollar. ETF flows can reverse the tape for weeks at a time. Positioning can make a technically correct thesis lose money for a month before it works.
I mention this because the traders who blow up are usually the ones who found one clean model and then treated it as complete. The triangle is a filter. It's not a crystal ball.
The Question That Actually Matters
So back to the pullback question I started with. Is a dip in gold the thing that hurts the bulls? Or the thing that gives them a real entry for the first time in weeks?
That depends entirely on which regime you're in. And if you can't answer that question, you don't have a trade yet. You have a hunch with a stop loss attached.
I've spent a decade staring at these three charts. The honest answer is that the relationship is never fixed. It's conditional. The traders who make money are the ones who figure out which condition they're in before they place the order. Everyone else is just guessing with leverage.
So here's what I want to know from you. When the dollar and yields move together, which one do you actually trade? Or do you shut the screen off and wait for the regime to declare itself? Tell me in the comments. I'm genuinely curious how other people read this thing.
```